I haven’t written much about debugging yet, but tools to help debug my code have been essential to my system development. I started out with the simple Ben Eater 6502 build where debugging consisted of repeating a cycle of write code, assemble and burn it to an EEPROM, and test the system for proper operation, maybe with some output to the LCD.
In my builds since, automating the code assembly into my editor and using a ZIF socket greatly sped up this cycle. I could turn around a new code sample in about 10 seconds. But that didn’t really help knowing what was going on with the code in detail such as being able to examine registers or memory during execution, set breakpoints or step through code.
In my second build, I started developing a monitor program that would allow me to do just that, as well as to upload code over a serial connection to memory for testing. I found that this development cycle still took too long as uploading the file actually took longer than what I finally got to with the write/burn/test cycle.
It was about this time, when looking for ideas for an operating system I came across Py65, a simulator for 6502-based systems. It has the ability to set breakpoints, step through code, and examine memory and registers during code execution. To be honest though, I still found it easier to just continue with my old routine but replacing the EEPROM burn part with loading the code into the simulator. That was even faster than the burn as it could be done with a batch file.
I didn’t care much for adding breakpoints by typing in addresses and examining memory took a lot of typing as well. This is when I discovered I could debug the simulator itself in Visual Studio Code, using its superior debugging interface to set breakpoints, step through code and watch specific registers and memory locations.
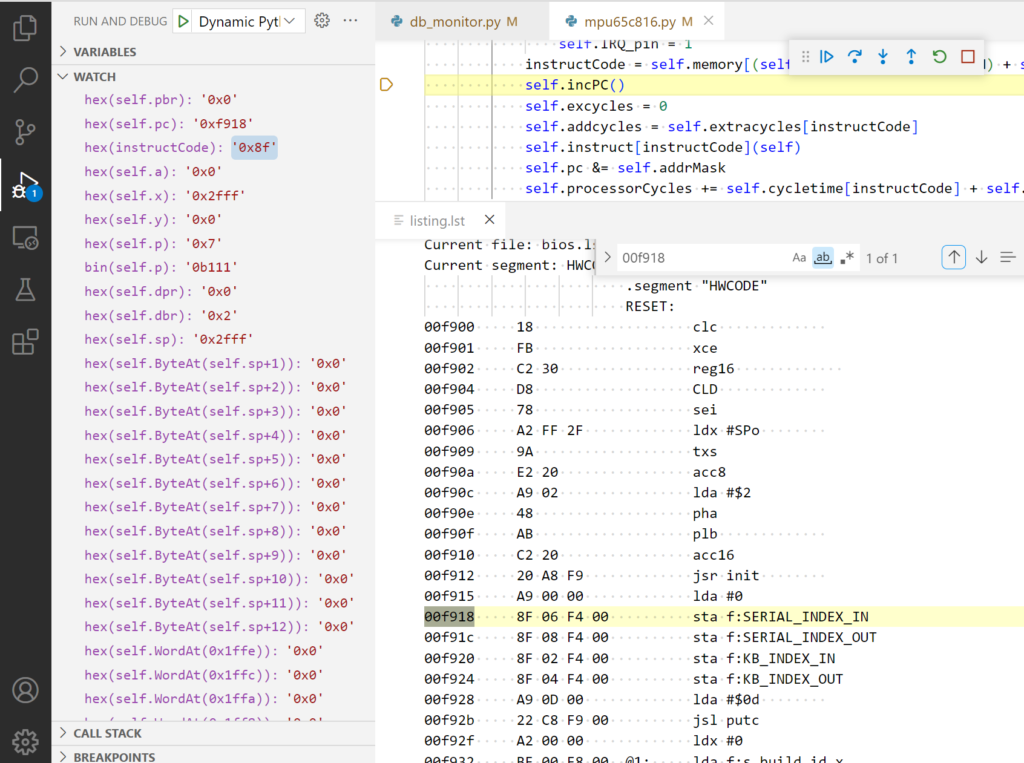
This got me through development of my Forth operating system for the 6502 and porting it to the 65816. It had problems though. It was slow and you were actually setting breakpoints on and stepping though the Python simulator code, not the 65xx assembly source code. To work with your 65xx source code, you had to set one breakpoint in the simulator code to break when the program counter was at the desired source location and when it was hit, you’d set another breakpoint in the simulator step function to single step through your code. Since none of this was linked to the 65xx source code, you had to manually follow along with a listing file. All of this recently changed when I learned that VS Code can do so much more.
VS Code can attach directly to the Python simulator
Starting up my Forth operating system in VS Code was slow, even with the changes I made to the simulator that I discussed in 65816 Emulator – Threading in Python is Very Slow. Loading and processing the several kilobytes of Forth code that comprises part of my operating system took about two and a half minutes running the simulator in the VS Code Python debugger. Standalone, the simulator did this in under 15 seconds. In researching VS Code debugging capabilities though, I discovered that you could attach VS Code to an already running process. Bingo, I could start my simulator up normally in 15 second and then attach the VS Code debugger for a much faster debugging experience. But VS Code could still do more.
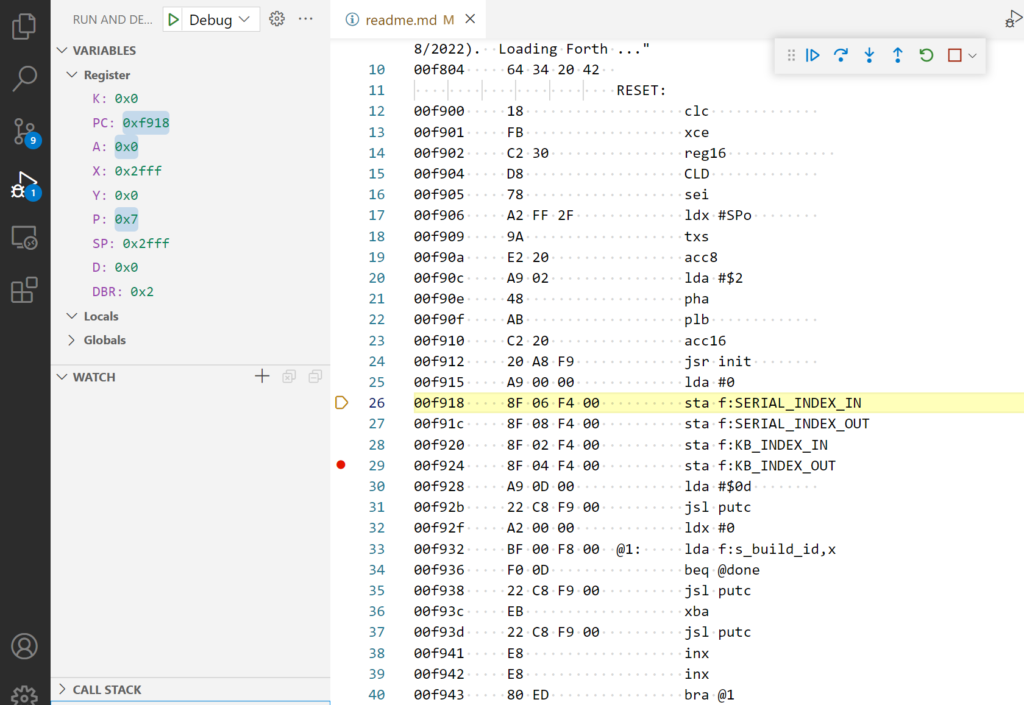
Debugging 65xx source code with VS Code
A recent post over on 6502.org introduced me to Microsoft’s Debug Adapter Protocol and the VS Code Mock Debug Extension. A debug adapter connects VS Code to a simulator. Mock Debug provides a basic debug adapter and mocks up a simulated simulator for testing it. It’s intended to help kick start developing a debug adapter for your own debugger or simulator. The problem was modifying my simulator for the protocol, a message-based construct, would be a significant effort. I found that the mock debug adapter was pretty complete though and the simulated simulator easily modified to simulate the 65816.
It took me about a day to translate the core part of my Python 65816 simulator to Typescript, the language Mock Debug is written in. Other languages, including Python are possible but would take more effort to mockup a working version of my simulator. Even with that minimal effort the debug experience is vastly superior. I now can set breakpoints and step through the source listing directly, see changing register values (and other memory locations) each step, use the VS Code expression evaluation and watch features and see a call stack.
Some of this will take a bit more coding to refine, but so far looks very promising. And it seems very fast. Searching through the source file, which is over 350 kilobytes, for the specific instruction being executed is almost instantaneous. It’s not all roses though as Typescript is very different from Python and some Python features aren’t fully supported. In porting to Typescript, I had to make a number of modifications in addition to simply modifying for language syntax.
Also, what I’ve done so far isn’t a standalone simulator, but a simulated one that runs only in VS Code. I find that only about 50% or so of my testing is done in VS Code. The rest I use the simulator as a standalone application, avoiding the debugging overhead. I suppose this might be possible in VS Code as well as you can run Python at least withing VS Code without debugging, but I haven’t tried it with Typescript. I’ll need to decide whether to leave the simulator as a VS Code app, create a separate Typescript based simulator, or create a debug adapter for the Python based simulator. I’m not sure where I’ll end up, but it should be fun getting there.
A Standalone Typescript Simulator
I decided to go with a standalone Typescript-based simulator that VS Code can attach to for debugging 65xx assembly code.
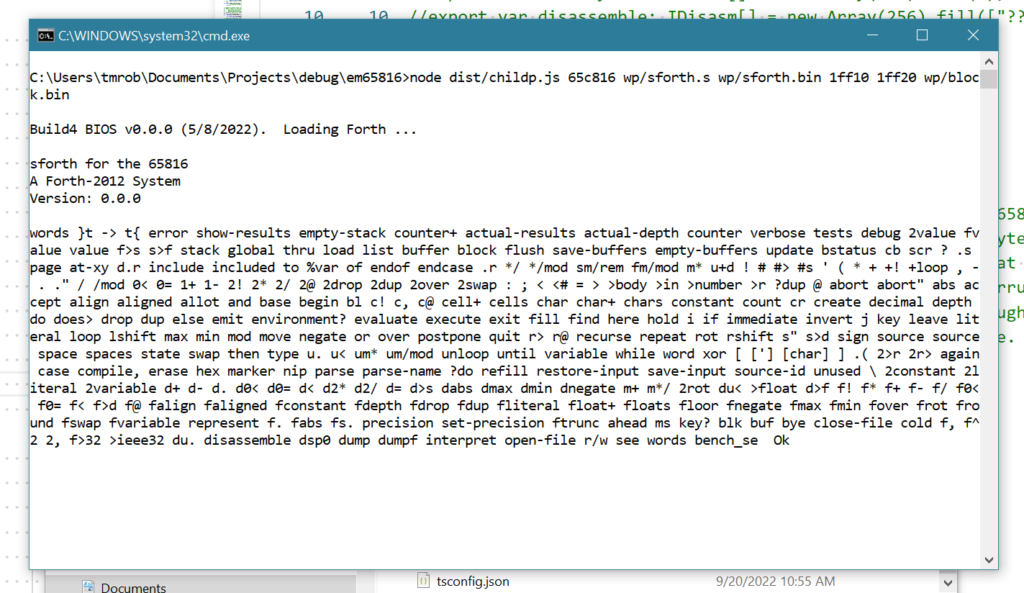
I chose this approach because it was easier coding the terminal I/O as needed by my hardware-based 65816 Forth operating system. I found working through the VS Code framework a bit cumbersome for this, but I’m guessing that’s mostly due to my limited experience with Typescript, Node.js and interfacing with VS Code.
It was a fairly simple matter to rearrange my code from above to have the VS Code debug adapter start this as a child process and communicate with it over the built-in IPC channel. You lose some efficiency as the simulator runtime can’t send event messages directly to VS Code. But I haven’t noticed any performance issues. The Typescript simulator is blazing fast compared to the Python simulator.
Still a lot of work to do
I guess I haven’t lost any debugging capability, given that I can still debug the Typescript simulator in VS Code just as I had done with the Python simulator. But I still have a lot of work to do to take advantage of all of the VS Code debugging features. And I have to rework the terminal I/O to correctly handle escape code sequences, which are used by my Mandelbrot program.
Speaking of which, I figured running that program would be a great test for my new debugger. My first challenge was my terminal I/O didn’t buffer pasted input the same way as the Python version. That will be an issue I’ll need to resolve soon, but I could get around it for this test by converting the Mandelbrot code into a single string and pasting that into the terminal. That loaded and compiled fine. But the simulator crashed when I tried to run the program. That was strange.
Obviously, I had introduced some errors in porting the simulator to Typescript. Unfortunately, I didn’t have the unit tests for the Typescript version that I had for the Python version. But those tests represent significantly more code than the simulator itself and would be impractical to port to Typescript. I did have Forth-based tests though which should help me narrow the problem a bit.
I didn’t take long to see a problem with the Forth-based tests. The system failed on the second test, essentially T{ 0 -> 0 }T I found that buried in that, the code was failing on the return from a DO/LOOP. A bit more examination showed that I wasn’t properly transferring a 16-bit accumulator to a 16-bit Y register on a TAY instruction. Only the lower 8 bits were being transferred. Since everything tested fine in the Python simulator, the error had to be with my port to Typescript.
Now, I noticed earlier in my Python to Typescript port work that Node.js does not handle operator precedence the same way as Python. As such I was fairly careful in my translation to ensure I enclosed the new Typescript expressions in parentheses as necessary to avoid ambiguity. (upon review for this post, I probably went overboard with this as the two are probably closer than I originally thought) I noted though in the TAY, TYA, TAX, and TXA code I hadn’t enclosed one equality subclause in parentheses. I figure this was the problem and confidently reran the “fixed” simulator. No luck, the simulator performed as before.
Digging deeper, I discovered that the problem lay in a simple piece of code that checked whether a given status register flag was set. The Python version of that code is:
    def isSET(self, x):
        return self.p & x
In converting to Typescript, I tried to translate that to a properly typed fuction that returns a boolean:
    private isSet(x: number): boolean {
        return (this.p & x) === 0;
    }
Do you notice the problem. The function is checking whether a particular flag is set and thus the proper function would be:
    private isSet(x: number): boolean {
        return (this.p & x) !== 0;
    }
I tested the code this time and found it doing what I expected. Confident again, I decided to test out some floating-point math. That used a good deal of the simulator. How about a simple addition and displaying the result.
1.2 3.4 f+ f.And the system crashed again. This worked for integers. As I expected, the floating-point routines gave the simulator a more rigorous testing. Obviously, I had more testing to do.
Success
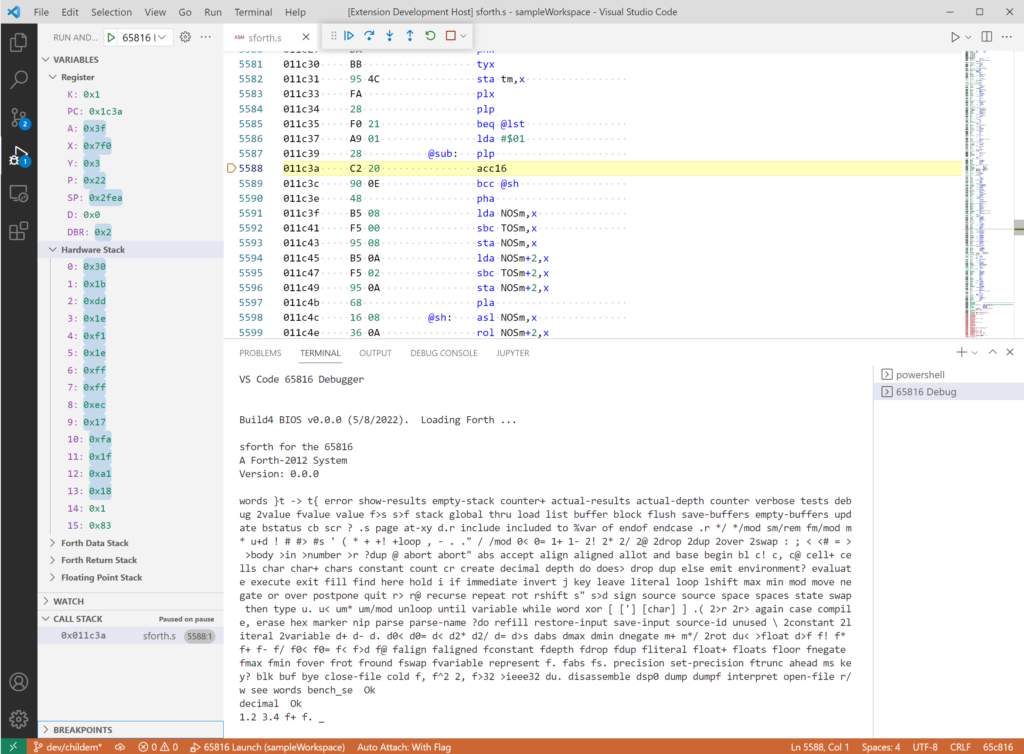
It took quite a bit of searching but I found a misplaced parenthesis in the code for the ROL instruction that prevented the left shift when the carry flag wasn’t set. Correcting that gave the expected result.
1.2 3.4 f+ f. 4.6 OkAll of my Forth tests now work but my Mandelbrot program still fails. I think the problem is with handling escape code sequences which are used to display the Mandelbrot plot. I have more testing to do!
Performance Testing
After isolating my problem to an input error in my Mandelbrot program, I was able to do some performance testing on my new Typescript-based 65816 simulator. I mentioned above that it seemed blazing fast and that’s true when looking at startup times in the VS Code debugger. The startup time with the Python version took about 2 1/2 minutes while debugging in VS Code. The Typescript version started up in about 8 seconds. However, the difference was dramatically less outside of VS Code with the Typescript version starting in just under 4 seconds and the Python version starting in about 11 seconds. Obviously, the Typescript VS Code interface is more efficient than the Python interface.
I was a bit disappointed when I didn’t see the “blazing fast” gains when running my Sieve of Eratosthenes and Mandelbrot performance tests but got things more in line with my non-VS Code startup tests. The Typescript version of the simulator ran the Sieve of Eratosthenes a little over two times faster than the Python version.
My 20-iteration Mandelbrot plot took about 69 seconds on the Typescript simulator compared to 151 seconds on the Python simulator, or again a bit over two times faster. I got the same results for a 100-iteration test, so output wasn’t a factor between the two tests.
With some confidence with the port of my 65816 simulator to Typescript I can work toward improving the interface with the VS Code frontend. Afterall, that was my original intent.