12/17/2022 Update: db65xx now handles normal debug stepping within C files.
I successfully ran my C-based Hello World example project in my VS Code db65xx Debugging Extension but needed a more rigorous test of C-based debugging. I often go to Rosetta Code to look for code samples to test on my various builds and find the Sieve of Eratosthenes, a simple algorithm that finds the prime numbers up to a given integer, perfect for testing and benchmarking (see my debugging post for example). As expected, Rosetta Code has a simple C program that the cc65 compiler could handle (see code under “Another example” as the primary example uses floating point which cc65 doesn’t support).
It was fairly easy to get the sieve program to compile with cc65. I had to create a new C library to support the memory, math and I/O functions used, but with that, the program compiled and ran on the first try. Amazing! Until I looked at the results:
cc65 Sieve of Eratosthenes results
Primes numbers from 1 to 10 are: 1, 3, 4, 8, 10,Huh? We all know that the prime numbers from 1 to 10 are 1, 2, 3, 5, and 7. What’s going on? Did I inadvertently change some of the essential code? I had made a few cosmetic changes, but nothing that should have altered the results.
After verifying that I did have the correct code, I puzzled over what the problem could be. Was my simulation of the 65C02 the problem. That would seem to be a likely culprit, but I have run the Sieve of Eratosthenes successfully from assembly code, so I didn’t want to jump right on that to start. There were other possibilities after all.
First, was the Rosetta Code correct? It would be strange for it not to produce the results shown, but I have had occasions where system differences cause problems, though those are usually caught at the compilation/assembly stage. I didn’t notice anything in the code that would cause a problem, it’s all pretty basic C code. Let’s try another C compiler.
I use the Microsoft command line C/C++ compiler for my everyday C compiling tasks, so it was straight forward to create another project using it. Running it, I got the published results with the final summary of:
Microsoft C/C++ Optimizing Compiler Sieve of Eratosthenes results
Primes numbers from 1 to 10 are: 1, 2, 3, 5, 7,So, the problem wasn’t with the Rosetta code. I would have been surprised if it was.
My next thought was that the version of the cc65 compiler I’m using has a problem. My copy of the compiler is almost two years old and cc65 had been updated many times since then. (I’m not sure about the versioning philosophy of cc65; it hasn’t released a new version since mid-2020 though many changes have been made to the master branch since then). Still, given the basic nature of the code, it would be surprising if the cc65 compiler was the issue. I didn’t want to go through the effort of updating my compiler for this unlikely case, so I decided to let db65xx do what it was designed to do and debug the program.
Debugging the Sieve of Eratosthenes
The first thing I noticed was that local variables weren’t available for inspection. I hadn’t activated any compiler optimizations (note that they are off by default), but I suppose that cc65 is designed to produce efficient 65C02 code and that registers would be used to the extent possible right out of the box.
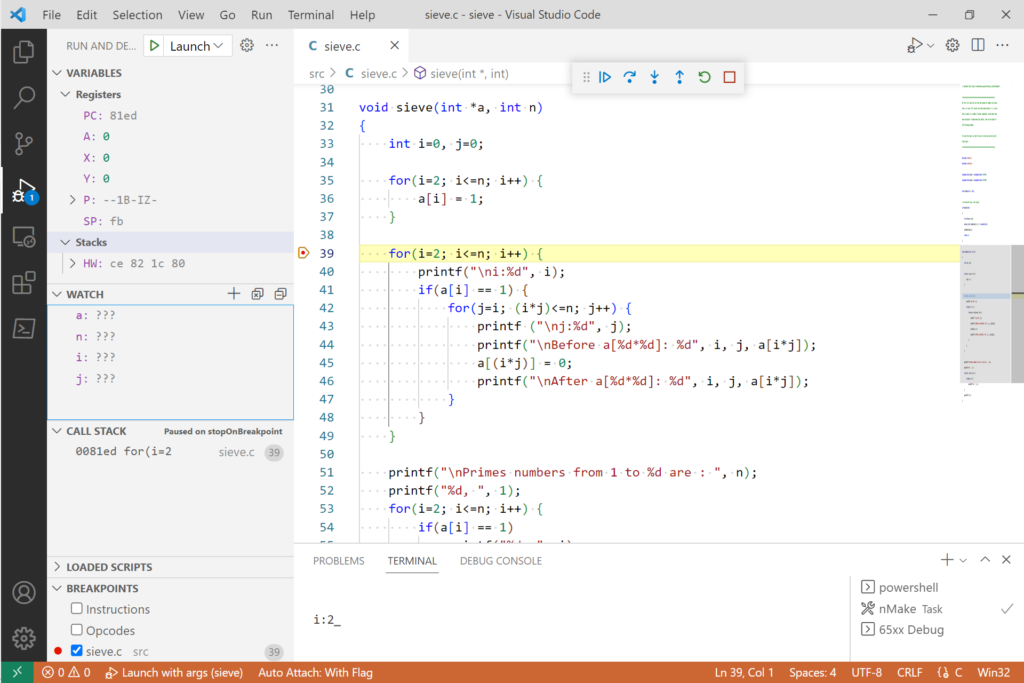
I could debug using the compiler generated assembly source code, but that’s not C-level debugging. Not being able to view local variables would greatly reduce the debugger’s usefulness. I wondered if I could force the compiler to generate symbols for them.
I’m not an expert on cc65, especially its C compiler, but it looks like there aren’t any options to force the compiler to create symbols for local variables. There is a pragma to create static local variables, which puts them in the BSS segment instead of on the C stack. This may get us a bit closer to what we want. But it’s still not a very satisfying solution.
Probing around in the program with the debugger some more, it appears that the prime number testing array was being initialized in the zero page. In fact. it’s being initialized in the same region of zero-page memory that is used by the C runtime. The C runtime was corrupting this array resulting in invalid prime number indications at the end.
Looking deeper, sure enough the pointer to the testing array was 0. It was not being properly initialized by the malloc routine. Looking at the malloc code I guessed that it was returning a NULL pointer because memory was full.
This seems to be pointing towards a problem with my configuration. I’m guessing that I’ve allocated all RAM to what the C runtime is using for data, but that this area isn’t available for allocation by the malloc routine, which is allocated from the heap. It’s unclear where that is specified. I’ll need to dig into this further.
Stay tuned. I’ll updated this post as I learn more.
Update
The problem turned out to be more basic than I thought. The heap initialization is performed in a module constructor at startup. When I prepared the C library for my hello world example project, I had commented out the subroutine call to the initialization routine as it wasn’t needed for that project. Adding the malloc module to the library requires heap initialization. Creating the library again with this corrected allowed the sieve program to run correctly (actually after several other configuration issues that I needed to address in this slightly more advanced C program; cc65 seems particularly troublesome in this regards).
Now back to testing the C code debugging experience.
Debugging Revisited: Local Variables on the C Stack
Since this example program only finds prime numbers from values up to 10, I’ve temporarily modified the local variables to the unsigned char type for ease of display.
By default, cc65 puts local variables on the C stack. This makes functions reentrant, but slower. Let’s look at how to debug this type of program. To start, it would be nice to know where the C stack is located. The debug file isn’t any help, but the map file lists the address of the stack pointer as address $2. Looking there as we start debugging, we see that for my system, the C stack starts at $8000 and fills downward into the heap segment.
We can step through the code by placing breakpoints at strategic points (single stepping isn’t currently available for C source code). We can see the stack location of local variables by examining the C stack as we do so. In the main routine, the array size variable, n, is placed on the stack at $7ffd and the prime number test array pointer is placed at $7ffe. A block of memory is allocated for the array from the heap beginning at address $334 (we’ll look at $335-$33e becuase we’re not interested in 0).
As we step into the sieve function, parameters a and n are placed on the stack at $7ffb and $7ffa respectively. The local variables i and j are placed on the stack at $7ff9 and $7ff8. Moving into the for-loop, we can see that the C stack is being used to pass parameters to internal functions that are used to initialize the array. This is all hidden while stepping at the C-source code level (but you can single step into the auto-generated assembly code if you’d like).
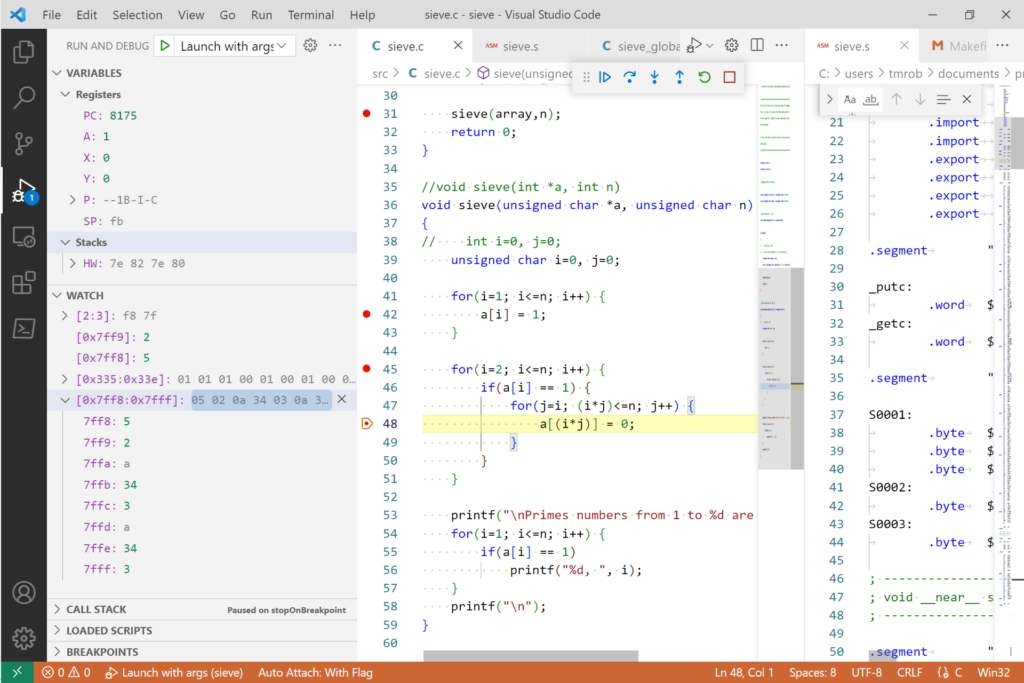
This isn’t a terrible debugging experience, but it’s far from a traditional one and keeping track of the local variables on the stack is cumbersome. We can do better by forcing cc65 to place local variables in the BSS segment using the static-locals pragma. The downside of this is that functions aren’t reentrant when this pragma is turned on. It can be switched on and off at the function level though, so you have some control during debugging.
Debugging with Static Local Variables
Making local variables static hasn’t changed much at the start of our program. The debug and map files provide pretty much the same information as before. First, it’s helpful to know that the BSS segment starts at address $300. That value is available from the map file at the symbol named __BSS_RUN__. “Stepping” through the program again while looking at this memory range we see the array size variable, n, allocated at memory address $304. The prime number test array pointer is allocated at $302. In this case, a block of memory is allocated beginning at $339 (as above, we’ll ignore the 0 value and look at the memory range $33a-$343).
Continuing stepping into the sieve function we find that i and j have been allocated to $300 and $301. We can also see that the C stack is still being used to pass parameters to the function.
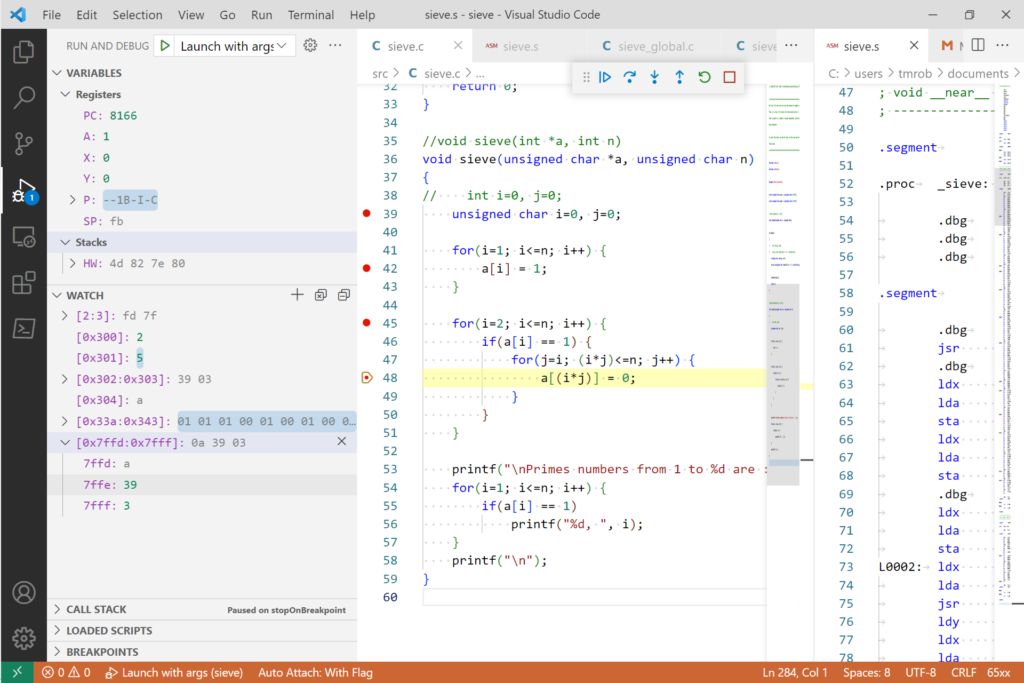
I don’t think using static local variables changed the debugging experience much. Basically, we just have to look at a different memory location for our variables. I suppose one benefit is that it separates the local variables from the function parameters. On the other hand, static local variables can be interspersed with heap allocations.
An interesting observation to note when stepping through the code is that db65xx won’t necessarily break as it passes every breakpoint. For example, the breakpoint on line 45 in the image above is skipped the first time into the loop. The is likely due to cc65 splitting the line between two or more addresses in the auto-generated assembly source file. It appears that I need to treat C code mapping similar to that for macros where a given source line can have more than one address associated with it. Of course, this makes sense for a for-loop where the first line is actually three statements.
Debugging with Global Variables
One way to overcome not having local variable visibility is to define them as global variables. The cc65 compiler then creates global symbols for these variables that db65xx has access to. Internally the global variables are defined in assembly source with an underscore prefix which must be included when we access them. As an added benefit, the db65xx hover feature works with these global variables.
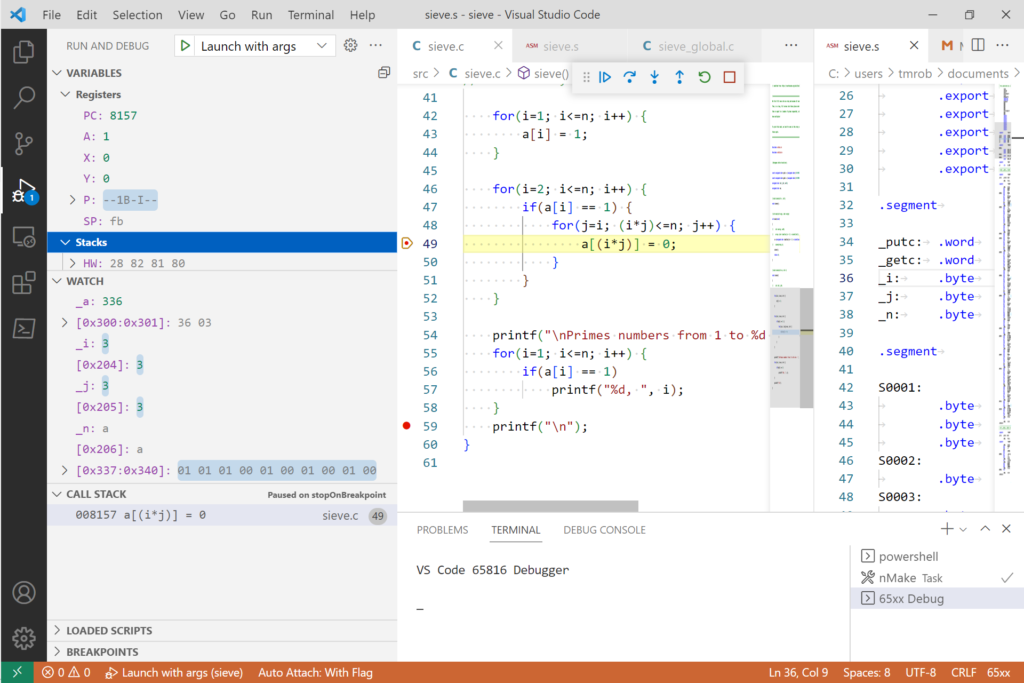
We can add watches for the sieve program array and index variables after redefining as global. For example, see _a, _i, _j and _n in the Watch pane in the snapshot below taken midway through the analysis.
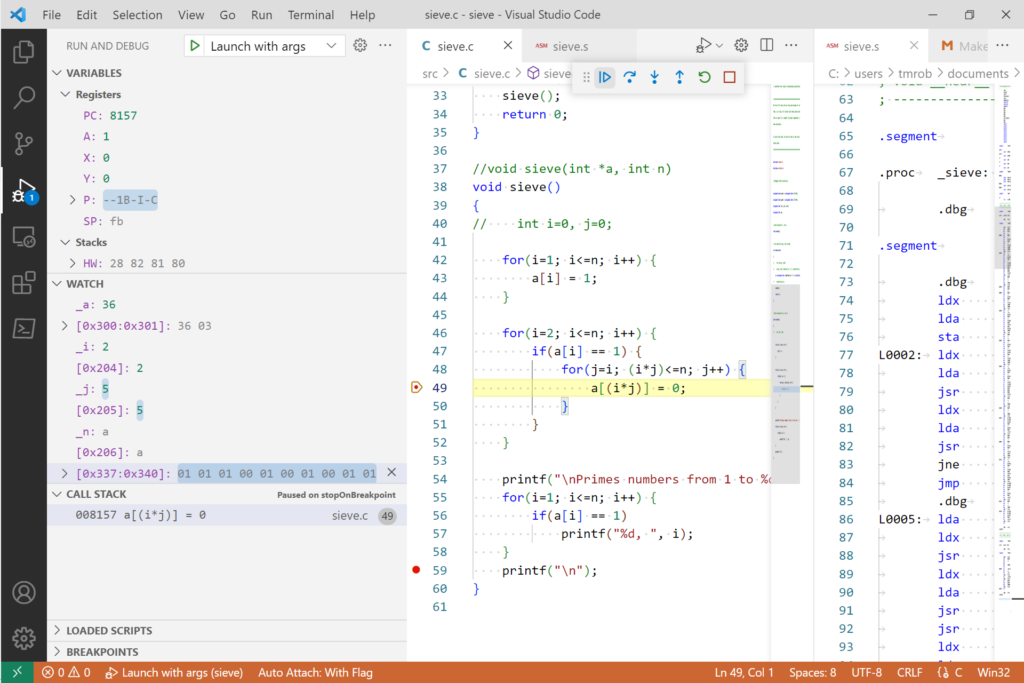
The global variables i, j and n look fine. But what’s up with the array pointer a with a value of 36 (recall that values are displayed in db65xx as hex)? This is the least significant byte of the pointer’s address. Normally, db65xx would dereference the pointer a as a two-byte address, but for some reason its size has not made it to the debug file (this is odd because cc65 has declared the symbols in the autogenerated assembly file similarly to how I have in my example projects where the symbols do get a size specified). We can look up the value directly in memory though. But where has cc65 placed it.
By default, cc65 will place uninitialized global variables in the BSS segment and initialized global variables in the DATA segment. In my sieve program, the DATA segment begins at address $200. The BSS segment begins at address $300. We can observe these memory ranges as we step through the program to figure out each variable’s location or we can look in the debug file to see exactly where they’ve been placed. I’ve shown the location of our global variables directly below their watch entries in the image above.
With a strategically placed breakpoint on line 49 and knowing the location of the prime number test array beginning at address $336, we can observe the test values of the array change at addresses $337 to $340, as the program evaluates non-prime numbers (note that the author includes the 0 value in the array, so we start at $337 rather than at $336 since we’re starting at 1). I put a breakpoint on line 59 as well to allow examining memory before the program completes. This isn’t really needed. When the program completes, the program sits in a loop in the library startup code. You can press pause at this point to examine variables and memory. (Note that this final loop isn’t efficient, on my system at least and can cause high CPU usage. I’ll probably modify db65xx to detect this situation on reduce its stepping frequency.)
Mystery Solved
I compared the cc65 auto-generated source file that didn’t put symbol size information in the debug file with my own that did. Looking with a more critical eye, there was a difference, but only in formatting. That wouldn’t cause the difference, would it? Well, it did!
Symbol declaration from original cc65 auto-generated source (symbol size not in debug file)
_putc:
	.word	$F001
_getc:
	.word	$F004
_i:
	.byte	$00
_j:
	.byte	$00
_n:
	.byte	$0A
_a:
	.word	$0000
Reformatted symbol declaration (symbol size in debug file)
_putc: .word $F001
_getc: .word $F004
_i: .byte $00
_j: .byte $00
_n: .byte $0A
_a: .word $0000
The debug file includes a symbol’s size if the symbol is declared on the same line that memory is reserved for it. Otherwise, the symbol’s size is not specified.
It’s not hard to edit the auto-generated file for a better debugging experience (see the properly sized a symbol in image below), but it’s not something I’d want to do for a big program.
You could also modify cc65 to change the format. I’ve done this type of thing in the past but have mostly abandoned it as it’s a bit of a pain keeping a different version. I guess I could submit a pull request for the change, but given that the debug file is considered experimental, I doubt it’s worth the effort.
This test has shown me a few things I need to update in the db65xx extension for C based debugging and has given me some ideas for improving it. I’m not sure if it’s possible though to get to the same debugging experience as with assembly code without a bit more work.